Operationalizing Empathy as a Strategic Asset
Customer experience and employee engagement are definitive competitive advantages; empathy has transitioned from a “soft skill” to a hard, strategic imperative. The ability to deeply understand the needs, motivations, and frustrations of both customers and employees is no longer optional; it is the foundation upon which resilient and innovative organizations are built. However, this understanding cannot remain an abstract ideal. It requires a structured, repeatable process to be captured, analyzed, and translated into action.
The Empathy Map stands as the primary artifact for this process—a collaborative tool designed to bridge the critical gap between raw human data and actionable business strategy.
Find reading a challenge, listen to a deep dive here:

In this post, we will explore the Empathy Map, tracing its journey from a simple brainstorming tool to a sophisticated framework for strategic insight. It will deconstruct the tool’s origins and thoughtful evolution, providing a definitive guide to its components and the psychological principles that underpin them. Furthermore, it will explore the map’s versatile applications, offering detailed playbooks for its use in driving human-centered customer strategy and, just as critically, for its internal application by leaders seeking to build more supportive and effective organizations. Finally, it will examine the crucial disciplines of validation and continuous iteration—the practices that separate a truly valuable empathy exercise from a performative one, ensuring the map’s integrity and transforming it from a static deliverable into a living strategic asset.
The Genesis and Evolution of a Human-Centered Tool
The Empathy Map’s credibility and effectiveness are rooted in a history of practical application and deliberate refinement. Its evolution from an informal sketch to a globally recognized strategic tool reflects a maturing understanding of how to operationalize empathy within business and design contexts.
The Precursor: XPLANE’s “Big Head” Drawings
Long before the Empathy Map was formalized, the design consultancy XPLANE was pioneering visual methods to understand users. A key practice involved the creation of what were called “big head” drawings. During the discovery phase of projects, XPLANE’s then Creative Director, Scott Matthews, would lead collaborative sessions where teams would sketch large, caricature-style heads to represent the target user or persona. Information gathered from research and brainstorming was captured on sticky notes and placed either inside the head or around the sketch, depending on the nature of the insight. These co-created artifacts served as a dynamic, visual repository for ideas and observations about the people for whom the teams were designing, establishing the visual and collaborative DNA that would become central to the Empathy Map.
The Formalization: Dave Gray and “Gamestorming”
The person credited with refining these early concepts into the Empathy Map is Dave Gray, the founder of XPLANE. Gray sought to create a more structured tool to curb the persistent miscommunication that occurred between teams and their target audiences, and to foster a deep, shared understanding among project stakeholders.
The Empathy Map was officially introduced to a wider audience in the influential 2010 book Gamestorming: A Playbook for Innovators, Rulebreakers, and Changemakers, which Gray co-authored with Sunni Brown and James Macanufo. This context is important; the map was not presented as a standalone template but as part of a comprehensive toolkit for visual thinking, innovation, and collaborative problem-solving. Its purpose was to help teams develop profound empathy for other people, which could then be applied to improve customer experience, design better work environments, and navigate complex organizational politics.
The 2017 Update: A Response to a Decade of Use
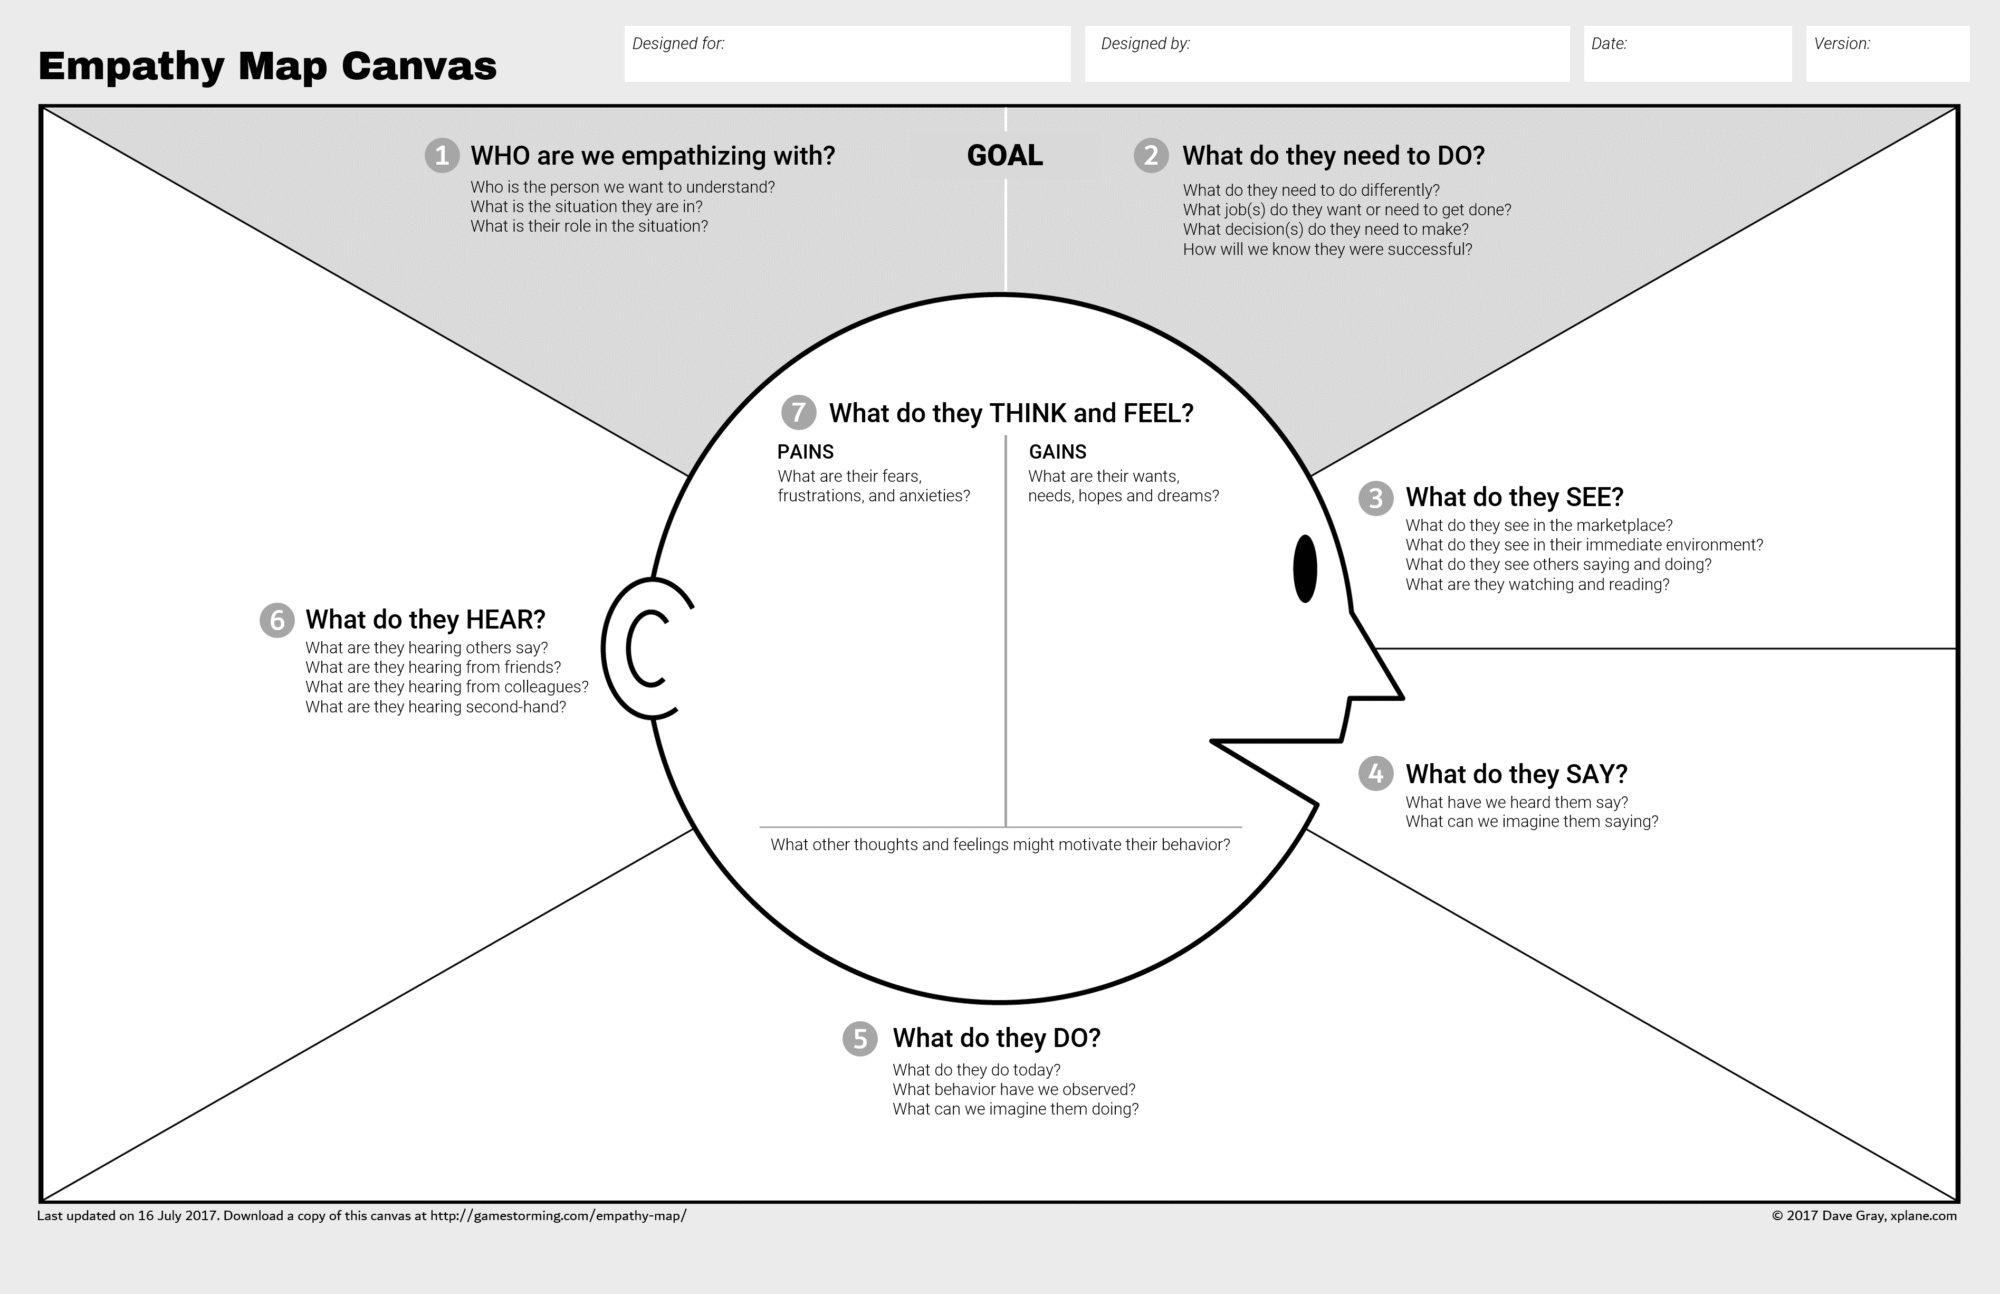
After nearly a decade of widespread use and feedback, Dave Gray introduced a significant update to the tool, which he called the Empathy Map Canvas. This revision was heavily influenced by what he learned about canvas design while collaborating with Alex Osterwalder, creator of the renowned Business Model Canvas. The goal was to make the tool more usable and to drive better outcomes by making the process more explicit and purposeful. The key changes were strategically significant:
- Incorporation of Goals: The updated canvas explicitly begins with a goal-oriented frame: a section at the top to define WHO the person is and WHAT they need to DO. This crucial first step provides context and purpose for the entire exercise, ensuring the team is aligned on what success looks like from the user’s perspective before diving into details.
- Numbered Sections: The quadrants and sections were numbered to guide teams through an intended sequence. This transformed the exercise from a simple data dump into a more logical flow of analysis, starting with the user’s goal, moving to observable phenomena, and then proceeding to inferred internal states.
- Centralizing “Think and Feel”: The “Think and Feel” element was moved to the center of the map, inside the head. This was a deliberate visual choice to emphasize the critical distinction between the external, observable world (what users See, Say, Do, and Hear) and their internal world (what they Think and Feel), which can only be inferred and must be validated.
- Reinstating “Pains and Gains”: Based on user feedback on an initial draft of the update, the “Pains” (frustrations, obstacles) and “Gains” (aspirations, measures of success) were explicitly added back inside the head. This acknowledged their vital role in identifying the core problems to be solved and the key value to be delivered.
Interestingly, the language in the “Goal” section was also refined based on feedback. An early version, “What do we want them to do?”, was perceived by some as manipulative. Gray updated the language to allow for a broader scope of inquiry, such as “What do they need to do?”, shifting the focus from the team’s objective to the user’s own needs and motivations.
Widespread Adoption and Influence
The Empathy Map’s practical utility led to its rapid and widespread adoption. It has become a staple in the curricula of leading design institutions like the Stanford d.school and was highlighted by IDEO founder David Kelley in the Harvard Business Review as a key creativity tool. Major consultancies and research groups, including Accenture and the Nielsen Norman Group, have also incorporated it into their practices. This broad acceptance by industry leaders underscores the tool’s proven value in putting a human-centered framework around the complex challenge of understanding an audience.
The tool’s evolution from a simple four-quadrant sketch to a more structured, goal-oriented canvas mirrors the maturation of the Design Thinking field itself, from a nascent focus on user-awareness to a more disciplined, strategic methodology that integrates empathy with rigorous business frameworks.
| Feature/Component | Classic Empathy Map (c. 2010) | Updated Empathy Map Canvas (2017) |
| Core Structure | Four-quadrant layout, often with the user in the middle. | Numbered, sequential layout designed to guide the process. |
| Key Quadrants | Says, Thinks, Does, Feels. | Adds explicit sections for Goal, Who, Sees, and Hears. |
| Starting Point | Often started directly with filling in the four quadrants. | Explicitly starts with defining the ‘Who’ (persona) and their ‘Goal’ (what they need to do). |
| Central Focus | Capturing a general snapshot of the user’s experience. | Emphasizes the distinction between observable phenomena (outside the head) and inferred internal states (inside the head). |
| Key Outputs | A high-level understanding of the user. | Adds explicit ‘Pains’ and ‘Gains’ for deeper analysis of frustrations and aspirations, leading to more targeted insights. |
Deconstructing the Empathy Map: A Framework for Shared Understanding
The Empathy Map is a deceptively simple tool. Its power lies not just in the categories it presents, but in the structured way it forces a team to move from external observations to internal inferences, creating a holistic and nuanced portrait of a user’s experience. Each component serves a distinct strategic purpose.
The Foundation: Setting the Scene
Before any quadrants are filled, the updated Empathy Map process begins with two foundational steps that frame the entire exercise.
- WHO are we empathizing with? This is the non-negotiable starting point. The team must clearly define the specific user or persona the map will focus on. This could be based on existing, well-researched personas or a specific user segment under investigation. Attempting to map a generic “user” will result in a vague and useless artifact. To ensure clarity and depth, a fundamental rule is one persona per map.
- What do they need to DO? (The GOAL) This step establishes the context and purpose of the map by defining the user’s objective from their own perspective. It answers critical questions like, “What task are they trying to complete?” or “What does success look like for this person in this specific situation?” This framing prevents the mapping session from becoming an aimless collection of disconnected facts and focuses the team’s attention on a specific problem space.
The External World: Observable Phenomena
The next set of quadrants focuses on capturing data that is, in principle, directly observable or verifiable through research. This is the “outside the head” portion of the map.
- What do they SEE? This quadrant explores the user’s sensory environment. It considers what they see in the marketplace, in their physical surroundings, or on their digital screens. This includes competitor products and advertising, content on social media, the design of a website or app, and what others around them are doing.
- What do they SAY? This section is reserved for direct, verbatim quotes gathered from qualitative research. These quotes can come from user interviews, usability testing sessions, customer support calls, or public reviews. Using the user’s actual words is critical for maintaining authenticity and avoiding the injection of team bias.
- What do they DO? This quadrant documents the user’s concrete, observable actions and behaviors. Examples include refreshing a page multiple times, comparing prices across different tabs, abandoning a shopping cart, or using a product feature in an unexpected way. This section is vital for identifying potential disconnects between what a user says and what they actually do.
- What do they HEAR? This captures the influence of the user’s social and media environment. It documents what they are hearing from friends, family, colleagues, trusted experts, influencers, or news reports. This is the “word-of-mouth” quadrant and reveals the powerful social pressures and external opinions that shape a user’s perspective.
The Internal World: Inferred Phenomena
This final set of components, located centrally inside the head on the updated canvas, represents the team’s inferences about the user’s internal state. These are hypotheses based on the observable data collected in the previous step and are the elements that most urgently require validation.
- What do they THINK & FEEL? This is the core of the map, where the team attempts to understand the user’s inner world.
- Thinks: This delves into what might be going on in the user’s mind that they don’t verbalize. It includes their beliefs, motivations, values, and the unspoken questions or concerns that drive their behavior. It requires the team to synthesize the observable data and ask, “What does this behavior tell us about what they truly value?”
- Feels: This captures the user’s emotional state throughout the experience. Emotions like frustration, anxiety, confusion, excitement, or confidence are documented here. These insights are often derived from observing subtle cues during research, such as body language, tone of voice, or hesitation.
- PAINS: This section explicitly lists the user’s fears, frustrations, obstacles, and anxieties related to their goal. These could be tangible issues like “the website loads too slowly” or more abstract fears like “I’m worried about my data privacy.” The Pains quadrant directly identifies the problems that the team needs to solve.
- GAINS: Conversely, this section details the user’s wants, needs, hopes, and measures of success. It answers the question, “What does the user hope to achieve?” Gains could be about saving time, gaining social status, feeling more competent, or achieving peace of mind. The Gains quadrant highlights the key opportunities for creating value and delight.
The map’s structure is deliberately designed to surface contradictions, for instance, when a user says a process is easy but their actions (Does) show repeated errors and their inferred feelings (Feels) are of frustration. These disconnects are not errors in the data; they are the most fertile ground for profound insights into unspoken needs and flawed mental models. The map is not just a collection tool; it is a diagnostic instrument for uncovering these critical gaps.
The Empathy Map in Action: Driving Human-Centered Customer Strategy
The true value of an Empathy Map is realized not when it is completed, but when it is used to drive strategic decisions. This requires a disciplined process that moves from preparation through collaborative creation to synthesis and integration with broader business activities.
Preparation: Laying the Foundation for Success
A successful empathy mapping session begins long before the team gathers around a whiteboard.
- Define Scope and Goals: The first step is to clearly articulate the purpose of the exercise. Is the team trying to understand the pain points of a new product feature? Explore the experience of a new market segment? Improve an existing service? Having a clear, specific objective ensures the session remains focused and the resulting map is actionable and relevant.
- Gather Research: The Empathy Map is a tool for synthesizing research, not a substitute for it. The quality of the map is directly dependent on the quality of the data that populates it. Teams must gather rich, qualitative data from a variety of sources, including one-on-one user interviews, contextual inquiries, surveys with open-ended questions, usability test recordings, customer support tickets, and social media comments.
- Assemble a Cross-Functional Team: The mapping session should be a collaborative effort involving individuals from different parts of the organization. Including representatives from product management, design, engineering, marketing, sales, and customer support brings diverse perspectives to the table.This diversity is crucial for building a holistic understanding of the user and for challenging the assumptions and biases that any single department might hold.
The Workshop: A Step-by-Step Facilitation Guide
The mapping session itself should be a structured, facilitated activity. Whether conducted in person or remotely, the core steps remain the same.
- Materials: For a physical session, a large whiteboard or butcher paper, sticky notes in various colors, and markers are essential. For remote or hybrid teams, digital collaboration platforms like Miro, Mural, or Lucidspark have become standard, offering templates and real-time collaborative features that replicate and often enhance the physical experience.
- Process:
- Introduce the Persona and Goal: The facilitator begins by reviewing the target user persona and the specific goal of the session to ensure everyone is aligned.
- Individual Brainstorming (Silent Generation): Team members are given time to individually review the research data and write down single observations or quotes on sticky notes. This “silent generation” technique ensures that all voices are heard and prevents groupthink from taking hold early in the process.
- Populate the Map: The team then comes together to place their sticky notes onto the corresponding quadrants of the map. As each note is added, the person who wrote it reads it aloud to the group, providing brief context if necessary.
- Cluster and Theme: Once the map is populated, the facilitator guides the team in grouping similar sticky notes together within each quadrant. This affinity clustering helps to identify emerging patterns, themes, and recurring issues.
Synthesis: From Data to Actionable Insights
With the map populated and themed, the team transitions from data collection to sense-making.
- Analyze and Discuss: The group steps back to look at the map as a whole. The facilitator should prompt discussion with questions like: “What patterns do we see?”, “What is the most surprising thing on this map?”, and critically, “Where are the contradictions or disconnects?”.
- Synthesize Needs and Insights: The ultimate goal is to move beyond mere observations to define the user’s underlying needs and uncover actionable insights. Needs should be articulated as verbs (e.g., “needs to feel confident,” “needs to save time”) to stay focused on user goals rather than predefined solutions. Insights are the “aha moments” that reframe the team’s understanding of the problem and open up new possibilities for innovation.
Integration: Connecting the Empathy Map to the Broader Design Process
The Empathy Map is not a standalone artifact; it is a foundational input for other critical business and design processes.
- User Personas: The map provides the rich emotional and psychological detail needed to transform a flat, demographic-based persona into a vivid, relatable character that the team can design for.
- User Stories: The “Pains” and “Gains” quadrants translate directly into the creation of user stories for Agile development teams. A “Pain” becomes a problem to be solved, and a “Gain” becomes a benefit to be delivered, forming the basis of a product backlog.
- Journey Maps: While an Empathy Map provides a snapshot of a user in a specific context, a Customer Journey Map visualizes their experience over time. The Empathy Map provides the crucial data for the “Thoughts” and “Feelings” lanes at each touchpoint of the journey, revealing the emotional highs and lows of the entire process.
In this way, the Empathy Map acts as a critical translation layer. It takes the messy, unstructured data of qualitative human research and organizes it into a structured format that can inform quantitative business decisions, prioritize development work, and ensure that strategic initiatives are grounded in a genuine understanding of the customer.
A Mirror to the Organization: Applying Empathy Mapping for Leadership and Employee Insight
While most commonly associated with customer-facing product and marketing teams, one of the most powerful and underutilized applications of the Empathy Map is internal. By turning the lens inward, leaders can apply the same human-centered principles to understand their most critical asset: their employees.
The Premise: Employees as an Internal User Base
The core premise is to treat employees as the “users” of the organization itself. Their daily experience is shaped by the “products” a company provides them: its processes, tools, communication channels, and culture. A leader’s job can be reframed as that of a designer, tasked with improving the “employee experience”. The Empathy Map becomes the primary tool for this internal design work, shifting leadership from a top-down, directive model to a more responsive, service-oriented one.
A Framework for Employee Empathy Mapping
The process for internal mapping mirrors the external one but requires a unique set of considerations and questions.
- Define the Employee Persona: Leaders should create distinct personas for different employee segments, as the experience of a new hire in engineering is vastly different from that of a tenured remote salesperson. Personas could be based on role, tenure, location, or other relevant factors.
- Define the Goal/Context: The team must clarify which aspect of the employee experience they are exploring. Examples include the onboarding process, the reaction to a major organizational change, the challenges of a hybrid work model, or the daily friction in a specific workflow.
- Gather Data (Anonymously and Ethically): This is the most sensitive step. Data must be gathered through channels that ensure psychological safety. Methods can include anonymous surveys, professionally facilitated focus groups or listening tours, and aggregated feedback from one-on-one check-ins. It is imperative that the goal is understanding, not surveillance.
- Conduct the Mapping Session: The leadership or management team convenes to collaboratively populate the map for the chosen employee persona, using the gathered data to inform their work.
The following table provides a guide for leaders to translate the Empathy Map’s quadrants into the context of the employee experience.
| Quadrant | Guiding Questions for Leaders | Potential Areas of Insight |
| Sees | What do they see in company-wide emails, on Slack/Teams channels, in team meetings? What does the physical office or digital workspace look like? What are their managers and peers modeling through their behavior? | Communication effectiveness, clarity of vision, cultural norms, resource availability, leadership consistency. |
| Hears | What are they hearing from their direct manager in 1-on-1s? What are they hearing from colleagues during lunch or in private chats? What are they hearing from rumors or the “grapevine”? What are they hearing from official company announcements? | Alignment of messaging, prevalence of rumors, manager effectiveness, team morale, trust in leadership. |
| Says | What are they saying in public forums like team meetings or company surveys? What direct feedback have they given? How do they talk about their work to their family or friends? | Public vs. private sentiment, stated concerns, level of engagement, brand ambassadorship. |
| Does | How do they interact with company tools and systems? How do they collaborate with other teams? Are they working long hours? Are they actively participating in initiatives or are they disengaged? | Process inefficiencies, tool usability, cross-functional collaboration issues, signs of burnout, engagement levels. |
| Thinks & Feels | What are their unspoken worries about their role or the company’s direction? What motivates them beyond their paycheck? Do they feel valued, respected, and heard? Are they feeling anxious, frustrated, inspired, or bored? | Job security anxieties, career growth aspirations, sense of purpose, emotional well-being, trust levels. |
| Pains | What processes cause the most friction and waste their time? What are their biggest frustrations with our tools or policies? What obstacles prevent them from doing their best work? | Bureaucratic hurdles, technology gaps, sources of daily frustration, roadblocks to productivity. |
| Gains | What would make their job easier or more fulfilling? What does success look like in their role? What kind of recognition or support do they value most? What are their aspirations for career development? | Opportunities for improvement, key motivators, impactful rewards and recognition, development needs. |
Use Case Deep Dive: Navigating Organizational Change
One of the most effective uses of internal empathy mapping is proactive change management. Before rolling out a significant change—such as a new performance management system or a departmental reorganization—leaders can map the anticipated reaction of a key employee persona. By hypothesizing what employees will think, feel, see, and hear, leaders can identify potential “Pains” (e.g., fear of being judged unfairly, anxiety about learning a new process) and address them preemptively. This allows them to refine the communication plan, provide better training, and build support systems before resistance can build, turning a potentially disruptive event into a smoother transition.
Use Case Deep Dive: Fostering a Culture of Trust and Diagnosing Disengagement
Regularly using empathy maps demonstrates to employees that their perspective is valued, which is a cornerstone of a high-trust culture. The map can also serve as a powerful diagnostic tool. If a team is showing signs of disengagement, leaders can create a map for a “Disengaged Employee” persona to explore the root causes. This structured exercise can reveal that the issue isn’t a single problem, but a confluence of factors: perhaps employees feel unheard, see a disconnect between stated company values and leadership actions, and hear negative rumors from other departments. A 2022 study on nurses in Brazil provides a compelling real-world example, where Empathy Maps were used to understand nurses’ frustrations and needs regarding professional development, revealing issues like a lack of incentives and time for training that might have otherwise remained unaddressed.
Using this tool internally is not merely an HR exercise; it is a leading indicator of organizational health. While metrics like turnover are lagging indicators, empathy mapping allows leaders to surface and address friction, frustration, and anxiety long before they result in lost productivity and attrition. It shifts the organization from a reactive to a proactive stance on its own culture and operational effectiveness.
Beyond the Canvas: Validation, Iteration, and Strategic Integrity
Creating an Empathy Map is only the first step. The practices that follow the initial workshop are what determine whether the artifact becomes a powerful strategic asset or a decorative piece of “innovation theater.” The disciplines of validation, iteration, and bias mitigation are essential for maintaining the map’s integrity and long-term value.
The Empathy Map as a “Living Document”
A common failure is to treat the Empathy Map as a one-time, static deliverable that is created at the start of a project and then filed away. To be truly effective, the map must be treated as a “living document”. Customer and employee needs are not static; they evolve with market trends, new technologies, and changing life circumstances. The Empathy Map must evolve with them. This means establishing a process of continuous improvement. Teams should regularly revisit their maps—perhaps quarterly or before major strategic decisions—and update them with new insights from ongoing research, customer feedback, and data analytics. When treated this way, the map transforms from a project-specific tool into a persistent knowledge asset—a longitudinal record of the organization’s understanding of its audience that can be used to onboard new team members and serve as a consistent reference point for all strategic conversations.
The Crucial Discipline of Validation
An unvalidated Empathy Map is a collection of a team’s own assumptions and biases, masquerading as user insight. The “Thinks” and “Feels” quadrants, in particular, are hypotheses that must be rigorously tested. Making business-critical decisions based on unverified assumptions is a direct path to design failure, wasted resources, and poor product adoption. This is where the practice of “Assumptions Mapping” becomes a valuable complement. After populating an Empathy Map, teams should identify the assumptions that are both most critical to the project’s success and most uncertain. These high-risk hypotheses are then prioritized for validation. The act of explicitly labeling an inference on the map as an “assumption” is the first step in this vital process. A non-validated Empathy Map is more dangerous than no map at all, as it creates a false sense of confidence and launders guesswork into perceived fact.
A Toolkit for Validating Empathy Map Assumptions
Validation is not a single action but a portfolio of research methods. The key is to choose the right method to test a specific type of assumption. The following table provides a practical framework for connecting the map’s quadrants to appropriate validation techniques.
| Quadrant to Validate | Key Assumption Type | Primary Validation Method | Implementation Notes |
| Says | “We assume users say they want a specific feature or have a certain opinion.” | Surveys, User Interviews | Use open-ended questions in interviews to elicit genuine opinions. In surveys, use carefully worded questions to confirm or deny stated preferences at scale. |
| Does | “We assume users will interact with the interface in a certain way or complete a task.” | Usability Testing, Data Analytics | Observe users directly in usability tests to see their actual behavior. Use heatmaps, clickstream data, and conversion funnels to validate behavioral assumptions with quantitative evidence. |
| Thinks | “We assume users are thinking ‘X’ when they hesitate on a page or make a choice.” | User Interviews (with ‘Why’ questions), Diary Studies | During interviews, probe into moments of hesitation by asking, “Can you tell me what you were thinking just then?” Diary studies can capture thoughts in the user’s natural context over time. |
| Feels | “We assume users feel frustrated by this process or delighted by this feature.” | User Interviews, Qualitative Feedback Analysis | Listen for emotional language and observe body language during interviews. Analyze the sentiment of open-ended survey responses, reviews, and support tickets to identify emotional patterns. |
| Pains / Gains | “We assume ‘X’ is a major pain point,” or “We assume ‘Y’ is a highly desired gain.” | A/B Testing, Prioritization Surveys (e.g., Kano Model) | Test a solution designed to alleviate a pain point against a control to measure its impact on behavior (e.g., conversion, task completion). Use surveys to ask users to rank the importance of various gains or pains. |
Mitigating Cognitive Biases
The human mind is prone to shortcuts, and these can undermine the empathy mapping process. The most significant threat is confirmation bias, the tendency to seek out and interpret information in a way that confirms one’s pre-existing beliefs. This defeats the entire purpose of the exercise, which is to challenge assumptions, not reinforce them.
Teams can implement several strategies to combat this bias:
- Embrace Diversity: Assembling a cross-functional team with diverse backgrounds and roles introduces different viewpoints that can naturally challenge ingrained assumptions.
- Seek Disconfirming Evidence: Make it an explicit goal of the synthesis phase to actively search for data points that contradict the team’s initial hypotheses. Celebrate these contradictions as learning opportunities.
- Acknowledge Assumptions Explicitly: Use the map’s structure to be intellectually honest. Clearly distinguish what is a direct quote (“Says”) or an observed action (“Does”) from what is an inference (“Thinks,” “Feels”). This simple act of labeling builds awareness of where the team’s knowledge is speculative.
The Future of Empathy as a Business Imperative
The Empathy Map has evolved from a simple sketch into a sophisticated and indispensable strategic tool. Its journey underscores a fundamental shift in business: the recognition that a deep, evidence-based understanding of human experience is the wellspring of both innovation and resilience. The map’s power is not inherent in the canvas itself, but in the disciplined process it enables—a process of collaborative inquiry, structured synthesis, and rigorous validation.
This analysis has demonstrated the map’s profound versatility. For customer-facing teams, it serves as the critical translation layer between messy qualitative data and prioritized business action, ensuring that products and services are built to address real, validated human needs. For leaders, it offers a transformative framework for looking inward, recasting employees as the users of the organizational experience and providing a systematic method for designing more supportive, efficient, and engaging work environments.
Ultimately, the Empathy Map is more than a tool; it is the operationalization of a mindset. It forces teams to move beyond their own perspectives, to challenge their assumptions, and to ground their strategies in the lived reality of others. In an increasingly complex and competitive landscape, the ability to consistently and effectively practice this discipline is not a competitive advantage—it is a condition for survival. The future will belong to the organizations that embed this process of empathetic inquiry into the very core of how they think, lead, and create.